
Building a Treasure Finding Bot (Part 2)
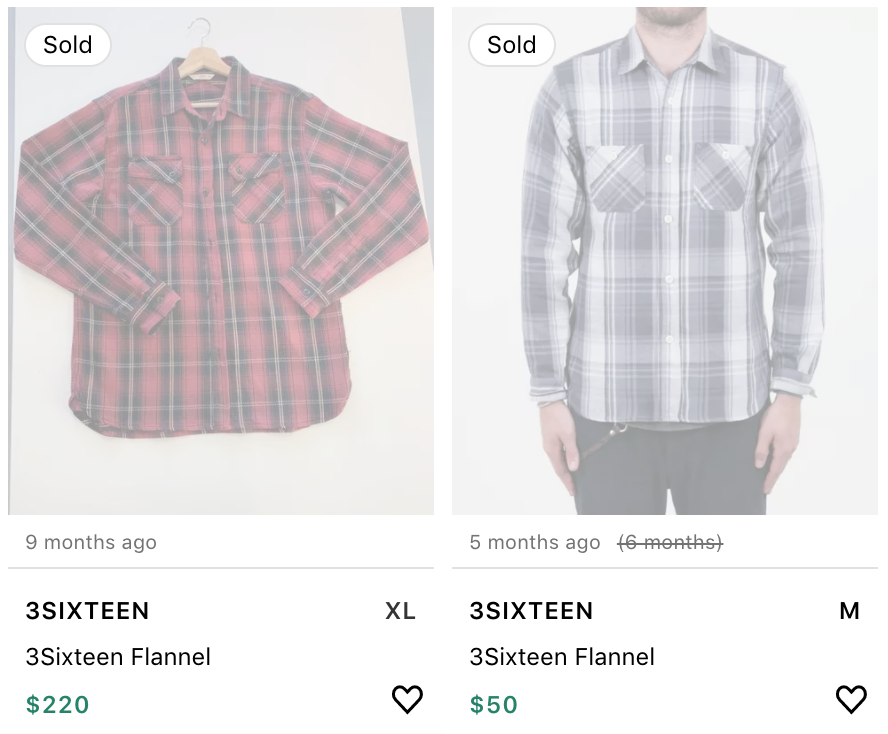
I had successfully managed to store Grailed's history of sold listings (here if you missed it), but I still had a daunting task in front of me. How could I use the historical data to determine what was a good deal or not? There were so many factors to consider, such as clothing condition, style, brand, item type, and even purchase time: an item that is currently hot might not have necessarily been hot a few weeks ago. In an ideal world, I would be able to match an article of clothing with all the sold listings of the exact same piece, compare the sell prices with the old ones, and determine whether it was a good deal. However, because users specify the details of the items they list, the inputs are freeform and no two listings are the exact same. There was no way to reliably determine that two items were the same directly from the information available.
Arguably, one could use image processing and machine learning to try to analyze the images, but that would probably make more sense for iteration number 10 or 11. On top of that, what if there was a new style introduced from a high-end brand at a super low price? If there is no history of the exact item selling, one wouldn't be able to determine whether the item was a good deal. However, if you were knowledgable about the popularity of the style, the quality of the brand, and general market price for these items, then you would be able to identify if the item was a good deal.
A brief overview of bot design
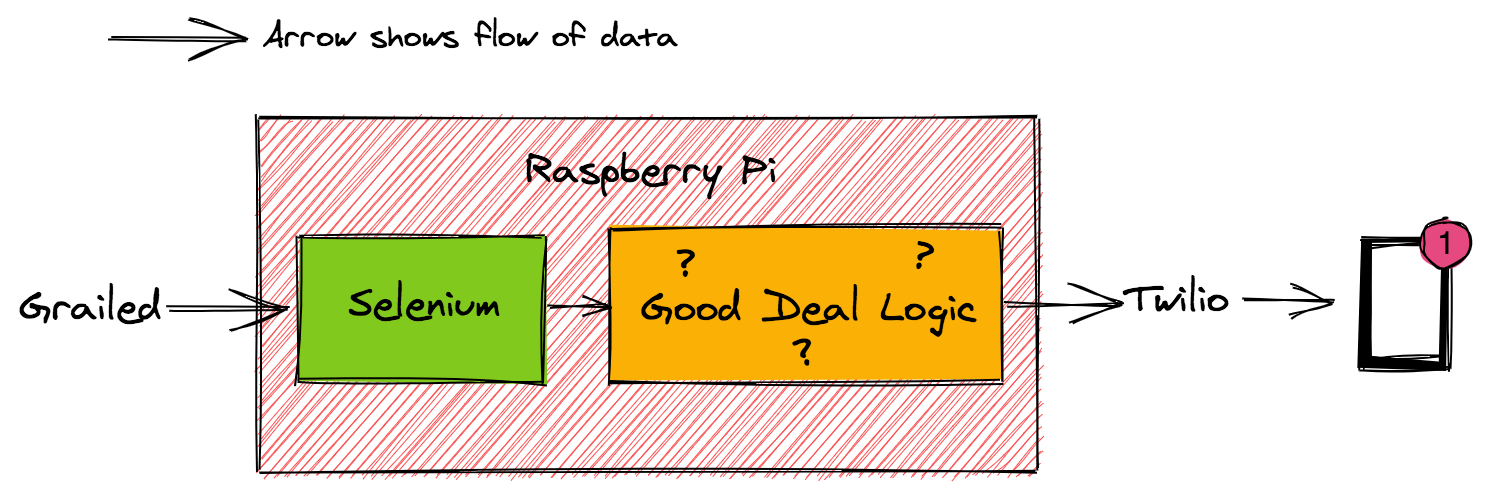
Before I dive further into good deal detection, I'll give a brief overview of the rest of the Treasure Finding Bot. Every 10 minutes, my Raspberry Pi executes code that uses Selenium to check all the new listings on Grailed, performs the logic to determine if new listings are good deals or not, and sends me a text message notification of new deals via Twilio.
Start simple
The logic to classify whether a new listing is a good deal can be thought of as a function that takes in a new listing and returns true for good deal and false for bad deal. I decided to follow the philosophy I usually take to development: start as simple as you can, and iterate. Given a new listing, I would take the new listing's brand and calculate the average sell price and the standard deviation of other sold items from the brand. If the new listing had a price that was one standard deviation below average, the bot would consider it a good deal.
I ran the function a few times manually with some test data and immediately realized it was a bad idea. The bot would consider nearly all product types that were generally cheaper (such as socks, underwear, and miscellaneous accessories) as good deals because they were consistently one standard deviation below average for brands that sold more expensive items like winter coats or fancy shoes.
Logically, the next step was to filter by subcategory. Grailed had multiple subcategories for listings that gave more detail on the style of the item, such as "Low-Top Sneaker", "Bomber", or "Socks & Underwear". Given a new listing, I would calculate the average and standard deviation of sold listings with the same brand and subcategory of the new listing, and use the same one standard deviation below average check to determine a good deal. On the surface, this seemed to work a good bit better than before, as normally priced underwear and accessories were no longer instantly marked as good deals. However, after implementing it and watching it run, I noticed that these average and standard deviation queries were expensive. If I took the average number of new listings found per 10 minutes and multiplied it by the amount of time needed to perform the calculations per listing, it would be longer than the 10 minute cadence of the program execution. I also didn't want to increase the time between program runs, as that would give a bigger time frame for others to notice the good deal and swoop in. To solve this, I decided to cache these calculations in a separate table subcategory_data. But then I ran into another problem of stale calculations. After collecting all of Grailed's data, I reconfigured my sold listing collector (built back in Part 1), to scan every hour for new sold listings and store them. The cached calculations in the separate table would not be able to take into account these new listings. This meant that I had to write a nightly job that would run on the Raspberry Pi to recalculate the averages and standard deviations every night. This small project was rapidly looking more and more like an actual service you would see at a company, albeit much more ghetto 😨.
First Run
I let the bot run for a few weeks to try it out. And it worked perfectly on my first try! Just like when I compile my code.
Nah just kidding, honestly it was a bit rough. Two major problems prevented the bot from being effective.
First, my good deal logic needed tweaking because standard deviation was occasionally very low. Ultimately I was hunting for deals so good that if I didn't end up keeping the item, I could make my money back by selling it. If a brand and category had an average of 50 dollars and standard deviation of 10 dollars, the good deal logic would consider 40 dollars for the item as a good deal. Assuming I purchased it and sold it for the average price, after Grailed had taken a cut and I had paid for shipping I would have gotten back less than what I paid.
Second, the bot was noisy! There were so many cases of items that were NOT good deals, but were marked as good deals because they were in categories of items for brands that were typically more expensive.
select
brands,
round(avg, 2) as avg,
round(stddev,2) as stddev,
count
from subcategory_data
where brands=ARRAY['Common Projects']
and subcategory_id=(
select subcategory_id
from categories
where subcategory='Low-Top Sneakers'
);
brands | avg | stddev | count
---------------------+--------+--------+-------
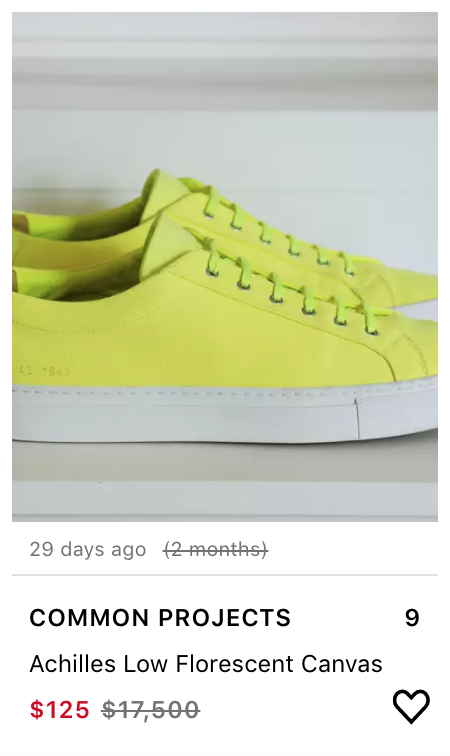
{"Common Projects"} | 217.89 | 76.10 | 4620For example, the subcategory "Low-Top Sneakers" and the brand "Common Projects" have an average price of $217.89 and a standard deviation of $76.10. Common Project Canvas shoes in Florescent green selling for $125 in the Low-Top Sneaker subcategory would be marked as a steal with my logic. In reality, the inexpensive shoe material, canvas, and the very unorthodox color made demand and average price for that specific item much lower than the calculated statistics.
On the other hand, the classic Common Projects Achilles Low White showing up for $180 would typically be considered a steal and wouldn't last an hour. According to the average and standard deviation calculated though, this wouldn't be a good deal!
Because of the problems with the bot, I still had to do quite a bit of due diligence in order to determine if an item sent to me by the bot was really a good deal or not. The whole point of this was to cut back on time I had to spend finding gems! There were occasional successes for sure, but the time spent to find these would have been the same had I just stuck to my usual habits of scrolling through Grailed every few hours manually.
Noise Reduction
To improve the user experience and minimize my effort filtering deals, I needed to reduce the noise. A temporary policy change I added to make the bot more strict was a hard coded threshold of $40. To be a good deal, the item had to be priced one standard deviation AND $40 below the average. This would allow some wiggle room to account for shipping and Grailed's fees in case I wanted to flip. In addition, if there were less than 10 items in the brand and subcategory, I would skip the good deal logic and mark the new listing as a bad deal. This was to avoid one-off items that sold for quite a bit in a subcategory, causing all other new listings to be then considered good deals. This helped cut back on the problem that occured when the standard deviation was too low of a number.
However, the problem of differentiating between "Common Projects Achilles Low Florescent Canvas" and "Common Projects Achilles Low Whites" was stepping into item identification and was a bigger issue to tackle. I wanted to have the title lend some influence on determining whether an item was a good deal. Ideally, titles that were more similar to the new listing's title would be weighted more heavily in the average and standard deviation calculation in comparison to titles that were less similar. After much musing and researching, I found myself considering Elasticsearch as a solution.
Elasticsearch is a popular open source search engine that can be dropped into almost any project that requires search. Elasticsearch had a lot of very attractive features, which made it clear that it would be superior to a simple home built solution. After indexing my Grailed data into an Elasticsearch server, I could query Elasticsearch with a string, and Elasticsearch would return an array of listings, ordered from most to least similar to the string. Additionally, it would provide a "similarity score" that scaled with how similar two strings were from each other. This was perfect! I could use the similarity score as a weight for the price. Then I could calculate a weighted standard deviation and average, and use the same one standard deviation below average check to identify good deals.
After unloading all of the data I collected from Grailed into an Elasticsearch server, I tried some queries and compared the results with the raw calculations I was using before:
When querying "Common Projects Achilles Low White" I get:
  avg   | stddev
--------+--------
 220.98 |  75.93
And when querying "Common Projects Achilles Low Florescent Canvas" I get:
  avg   | stddev
--------+--------
 218.56 |  75.47
Just the slightest difference in average and standard deviation, but not good enough. Because Elasticsearch scored and returned ALL items in the same brand and subcategory, if there was a lot of data the similarity score didn't make enough of an impact on the overall average and standard deviation. The brand "Common Projects" and subcategory "Low-Top Sneakers" had 4620 data points, which explained why the two averages and standard deviations were so similar. I realized that I had to actually limit the amount of data I considered for my calculations.
This realization was influenced by what I do in real life when I analyze the value of an item. I look at the items that are the most similar, and make a decision based off of those prices. Typically, the 10 most similar items are good enough to get a gauge on the value of the item. Additional listings would not provide any new insights, and considering any listings that were drastically different would just introduce noise. For the bot I had to do the same: limit the number of results I considered to a select group of the X most similar results.
After a few iterations of constants and manual observations, I settled on a constant value of 30. I would consider the top 30 most similar results to a new listing and use those to calculate weighted average and standard deviation. I probably could have been more mathematical about this but in the end, this was good enough for me! (As I am writing this post, one thing I realized I could have done is squared the weights so that the real similar ones were much more heavily weighted...I'm curious how that would have performed).
Now when querying "Common Projects Achilles Low White" I get:
  avg   | stddev
--------+--------
 247.20 |  67.63
And when querying "Common Projects Achilles Low Florescent Canvas" I get:
  avg   | stddev
--------+--------
 197.95 |  46.45
Not perfect, but much better! The $125 Common Projects Achilles Low Florescent Canvas are still considered a good deal, but certainly not as good as they were before. In addition, there's now a clear difference between the average and standard deviations of the two strings just like there should be.
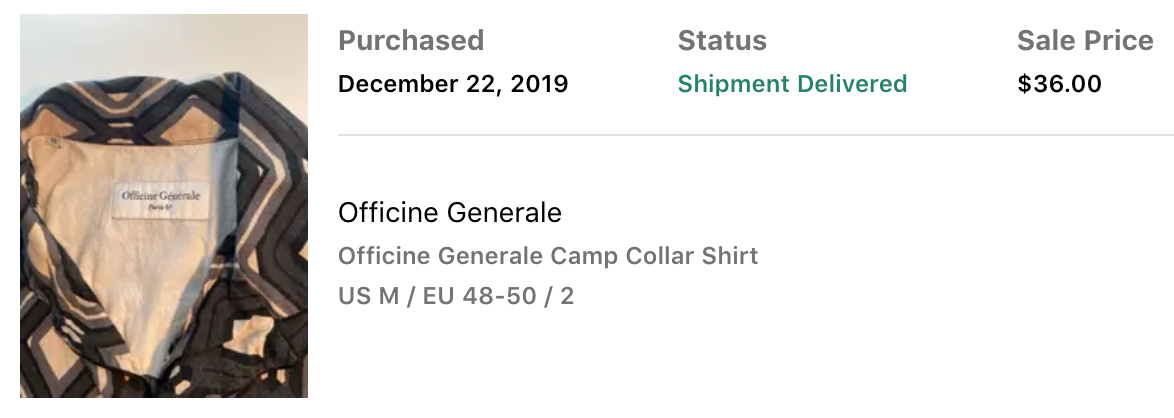
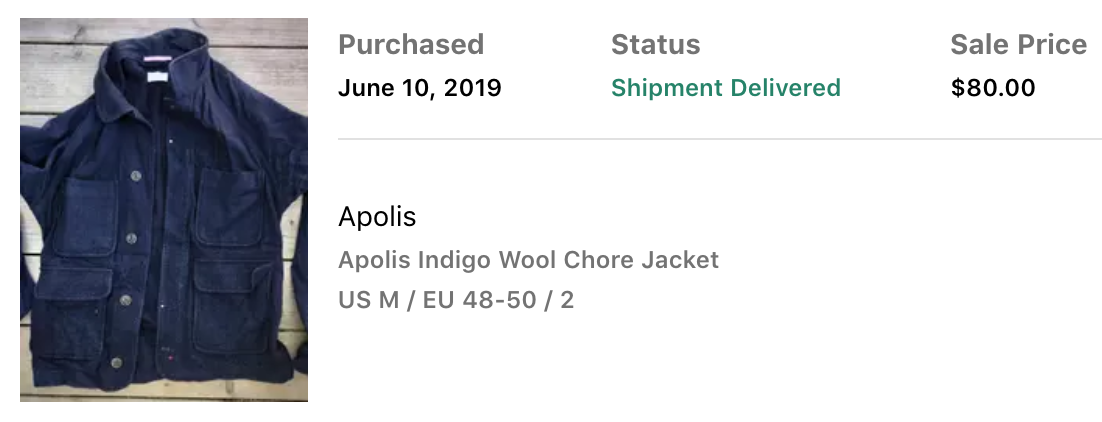
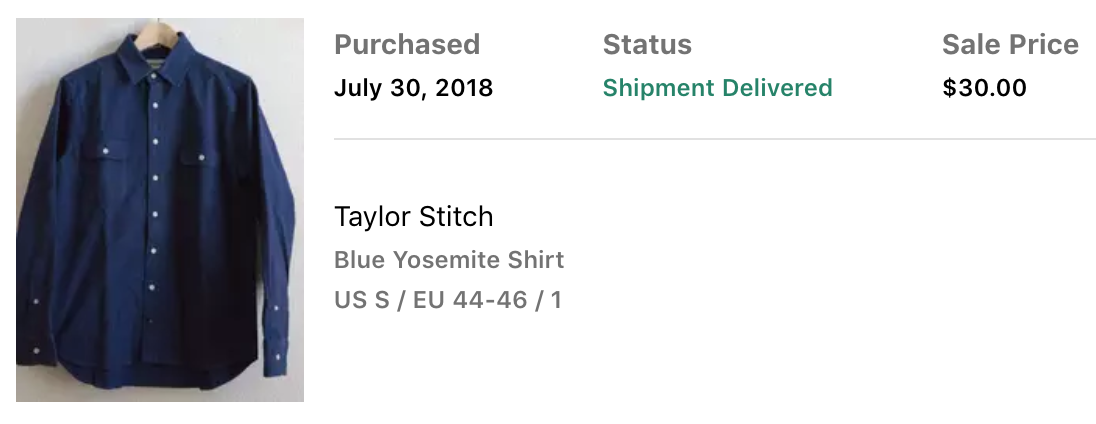
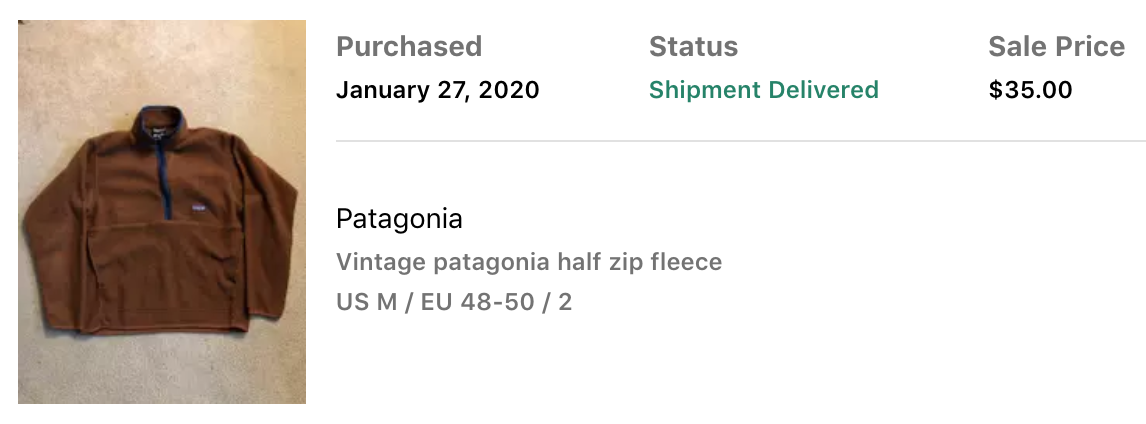
After improving the algorithm, the notifications become much less noisy and much more reliable. After running this for a year and actively buying and selling, I managed to make $1586.69. Unfortunately, $1480.98 of that money went to the good deals that I ended up keeping, putting me only up $105.71 🤨. All in all, I had quite a lot of fun with this project and managed to grab some great clothes for the low. My all time favorite snags that the bot found were as follows:
There were many more ideas that I had for the project, such as using sell date as a factor to more heavily favor the most recently sold items when making a calculation. This could have potentially helped detect currently trending clothing or more accurately represented prices for items whose values have decayed over time. I ultimately decided to stop here and call it a wrap for this side project—I was buying way too much! Onwards to the next adventure...